Restaurant Food Cost Control: A Practical Guide to COGS Discipline
This article is for chefs, owners, and controllers who need restaurant food cost discipline without turning the kitchen into a spreadsheet factory every night.
Key takeaways
- Food cost percentage is a lagging indicator—pair it with recipe costing, waste logs, and inventory variance to find levers you can pull this week.
- Macro commodity signals from USDA ERS, the FAO Food Price Index, and the BLS Producer Price Index explain why invoices move—not whether your line cooks followed the spec.
- Connect counts to sales: inventory plus POS data closes the loop between what you buy, what you use, and what you sell.
Table of contents
- Define restaurant food cost clearly
- Targets by concept type
- Seven levers that actually move COGS
- Worked example (illustrative)
- FAQ
- Sources
Restaurant food cost is the ratio of ingredient spend to food revenue for a period—usually weekly or monthly—expressed as a percentage. Operators who only look at the percentage monthly discover problems 28 days late; the best teams review daily key items and weekly category rollups.

Photo licensed via Unsplash.
Define restaurant food cost clearly
Use one consistent definition across stores:
- Numerator: purchases ± inventory change ± documented transfers.
- Denominator: food sales net of comps that are truly food (not service charges).
If your POS maps retail items into the same category as proteins, your food cost percentage will look artificially high or low—clean SKU mapping before you trust the metric.
Food waste research organisations such as ReFED emphasise that waste is both an environmental and margin issue; even if you do not publish sustainability goals, the financial case for tracking spoilage is enough for most independents.
Public health agencies such as the CDC foodsafety hub also reinforce that time–temperature control is not only compliance—it protects yield. Spoilage from improper cooling is a 100% loss on affected product, which shows up instantly in inventory variance if you count honestly.
Targets by concept type
Targets vary by pricing power and labour model—treat these as starting bands, not laws:
- Quick service: often 25–32% food cost if the menu is engineered for speed.
- Full service: often 28–35% depending on protein mix and complimentary bread programmes.
- Bars with heavy food: watch pour cost separately—do not blend spirits into food metrics.
If your rent is 12% of sales and labour is 32%, a 3-point miss on food cost can erase most of what should be leftover for maintenance and debt service—this is why recipe costing is not academic.
Industry associations such as the National Restaurant Association publish macro context on operator cost pressures; combine that narrative with your POS-level category mix so you do not mistake a national headline for a store-level execution problem.
Prime cost sanity check
Prime cost (food + labour) is a common owner lens—many independents aim near 55–65% of sales depending on rent and capital intensity. If food is 31% and labour is 34%, you are at 65% prime before utilities and repairs—tight but workable in some markets; if food slips to 34% without a pricing response, prime cost can breach 70% quickly. Use restaurant metrics framing to keep the conversation holistic.
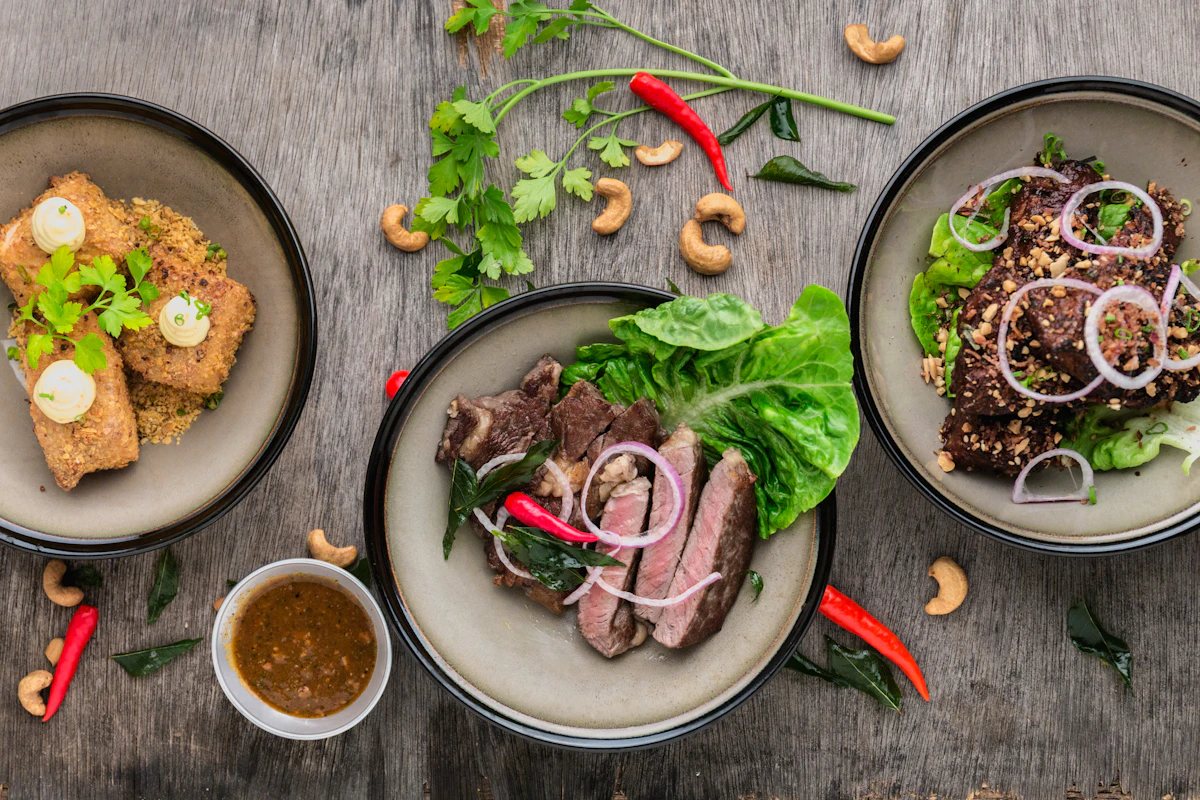
Photo licensed via Unsplash.
Seven levers that actually move COGS
0) Baseline your chart of accounts
Before you chase food cost percentage, confirm your POS categories match your P&L lines. If retail sauces or merch sit inside food COGS, you will fight ghosts in the spreadsheet. A 90-minute mapping workshop with finance and the chef prevents months of arguments.
1) Recipe costing with yield
Weigh trim and cooking loss. If a $9/kg protein yields 72% after trim, your effective cost is $9 ÷ 0.72 = $12.50/kg—before you add oil, rub, and finishing butter.
2) Par levels and ordering cadence
Set par based on lead time and shelf life. If a supplier delivers twice weekly, your walk-in should never hold more than ~3–4 days of high-risk seafood unless you enjoy spoilage surprises.
3) Waste logs with root causes
Track spoilage, prep mistakes, and return-to-kitchen separately. If 62% of recorded waste is over-prepping, the fix is training and batch sizes—not switching proteins.
4) Vendor management and bracket pricing
Negotiate on case economics, not vibes. If case price moves $6 on a 12-unit case, that is $0.50 per unit—small until you sell 2,400 units a quarter.
5) Menu engineering
Plot popularity vs margin. A high-traffic item with 6 points of margin below target either gets repriced, re-portioned, or removed—sentiment is not a COGS strategy.
| Menu engineering move | When to use it | What to watch | | --- | --- | --- | | Reprice | Strong demand + rising inputs | Guest pushback on sticker shock | | Re-portion | Drift in line checks | Plate appearance and value cues | | Substitute ingredient | Supplier shock + acceptable swaps | Brand promise and allergy notes | | Bundle | Lift attach on sides | Discount leakage if bundles are too generous |
6) Theft and unintentional generosity
Blind comp policies and manager void thresholds. A $14 unauthorised comp policy used 25 times per week is $18,200/year at run rate—before you count pour overages.
7) Weekly inventory discipline
Count weekly for top movers; monthly for long-tail dry goods. Tie counts to sales by category using POS category mapping—inventory variance should explain most surprises within 7 days.
Variance investigation: the 48-hour drill
When food cost jumps 2 points week over week, run this sequence before you panic:
- Invoice spike? Compare protein invoices to USDA ERS commentary and your contract brackets—$0.20/lb on a high-volume protein adds up fast.
- Sales mix shift? If burgers ( 38% target margin ) replace salads ( 52% target margin ) due to marketing, your food cost percentage can rise even if execution is perfect.
- Execution drift? Random 5-plate line checks during Friday service—if 6 oz becomes 7.2 oz, you do not need a new vendor; you need scales and a calm expo.
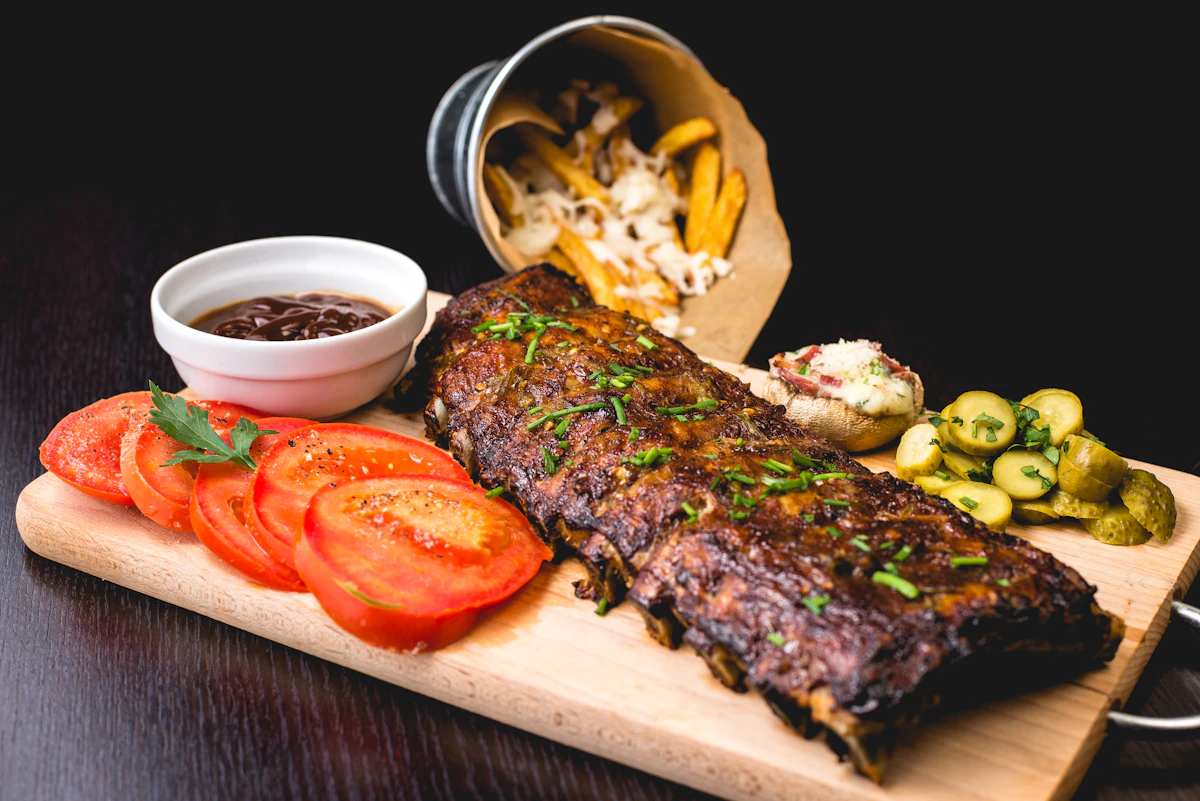
Photo licensed via Unsplash.
Worked example (illustrative)
Assume a $58,000 food sales week, $17,400 purchases, opening inventory $12,000, closing inventory $11,200:
- Cost of goods used ≈ $17,400 + $12,000 − $11,200 = $18,200
- Food cost % ≈ $18,200 ÷ $58,000 = 31.4%
If your target is 29.0%, you need roughly $1,392 less cost for the same sales—about 2.4 points—which often comes from three concurrent fixes, not one silver bullet.
That $1,392 gap might be $520 from portion drift on two proteins, $410 from over-prepping salads, and $462 from a missed vendor bracket on fry oil—your job is to prove which slice is real with counts, not anecdotes. If you cannot tie the gap to SKUs, revisit category mapping in POS before you blame the team.
Sensitivity: why small price moves matter
A $0.35 increase on a protein that sells 1,100 portions per month is $385/month—$4,620/year—before compounding across two proteins. That is why recipe costing includes yield and trim: the invoice price is only the beginning of the story.
Connect POS + inventory in the real world
Modern stacks treat inventory as operational—not only accounting. LightEgg’s inventory feature is designed to pair with how kitchens actually receive, prep, and deplete product. Use food cost calculator and inventory par calculator to sanity-check pars and plate math before you reprint menus.
For holistic KPI framing, restaurant metrics thinking helps you avoid optimising food while labour or prime cost blows up.
Consulting research on consumer and retail dynamics—such as Deloitte’s retail and distribution insights—often highlights how data visibility separates resilient operators from reactive ones. In kitchens, that visibility is item-level depletion tied to sales, not a monthly Excel from accounting that arrives 12 days late.
Multi-location discipline
If you run 2+ sites, centralise approved vendors and recipe cards—otherwise Site A will quietly run 92% of spec while Site B runs 88%, and your consolidated food cost percentage becomes a blame game. Give GMs a weekly top-10 variance list in dollars, not percentages: $2,400 of unexplained protein is a coaching moment; “+1.2 pts” is a shrug emoji.
FAQ
What is a good restaurant food cost percentage?
Most table-service brands aim near 28–35% depending on concept; quick service often lands lower. Your rent, labour, and capital costs determine what “good” means for you.
Should I include beverages in food cost?
Split food, NA beverages, and alcohol for clarity—blending categories hides real problems.
How often should I take inventory?
Weekly for high-value proteins and prep; monthly for stable dry goods—adjust if variance spikes.
What is the fastest way to reduce food cost without hurting quality?
Fix portioning and waste first—usually 1–3 points of improvement before you touch pricing.
How do commodity indexes help?
Use FAO and BLS PPI to explain invoice shocks to finance—especially when negotiating with suppliers.
What tools should a small team use first?
Start with food cost calculator for plate math, inventory par calculator for ordering discipline, and restaurant metrics for weekly KPI context—then graduate into inventory workflows as SKU count grows.
Sources
- USDA ERS — Food Price Outlook
- FAO — Food Price Index
- U.S. BLS — Producer Price Indexes
- ReFED — Food waste insights
- CDC — Food safety hub
- National Restaurant Association — Research
- Deloitte — Retail & Distribution Insights
- LightEgg — Inventory
Restaurant food cost control is a weekly habit: measure honestly, fix the top three variances, and repeat. When your data lives in inventory and POS together, you spend less time debating numbers—and more time cooking and serving.
A simple weekly rhythm (90 minutes)
- Monday 30m: purchases review + invoice anomalies flagged to vendors
- Wednesday 30m: line-check + waste log review with chef de cuisine
- Friday 30m: prep pars for weekend based on rolling 4-week sales and weather notes
If you cannot defend your food cost percentage with three concrete actions from last week, you are reporting, not managing. The food cost calculator is most powerful when it feeds decisions before the new menu prints—not after guests Instagram the old one.
Add one discipline that costs nothing but saves thousands: a single SKU owner per category (proteins, dairy, dry, oils) who signs off on substitutions. When five people can swap vendors ad hoc, you get five different yields—and a food cost percentage that oscillates for reasons leadership cannot explain to the bank.
Closing the loop with leadership
Share a one-page dashboard: food cost %, top 5 dollar variances, waste $, and menu engineering moves scheduled. When finance and culinary share the same definition of restaurant food cost, you stop debating ghosts—and start funding the next improvement, whether that is a new combi or a better vendor contract anchored to BLS PPI trends.